
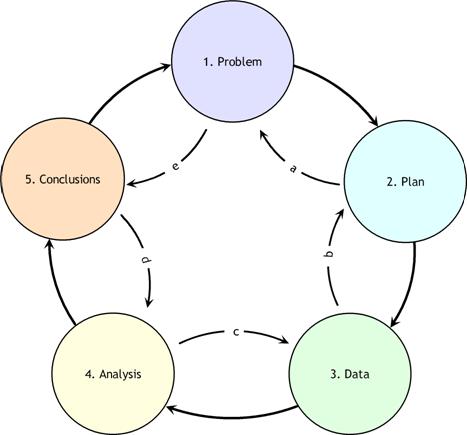
All data analysis projects start with a problem. We (hopefully) form a hypothesis before exploring the data, and we go about trying to confirm/disprove hypotheses with statistical procedures. These statistical procedures could be a simple t-test, a more complicated non-parametric bootstrap, or just producing a visual aid.
Most of the time, working in the industry, people approach me with a solution in mind. They know what they want to see and need my help confirming their views. In conversations, I try to back them out of that view point and prepare them for possible alternative outcomes. This is the point in which I start the data analysis, by trying to understand the problem. This usually involves defining the problem and variables involved as mathematically/logically as possible.
Mathematics gets it's power from defining things well. If we truly define our problem well, it will be worlds easier to find a solution. In fact, historically, major strides in mathematics were due to either a brilliant stroke of genius or a new and more precise way of defining objects and problems.
Once we have covered the problem, we talk about a possible approach. Most often than not, there are many possible solutions to a problem. In considering the many methods for solving a problem, remember that the simplest solution can be the best solution.
While talking about arriving at a solution, we should also be talking about the possible sources of data for the problem. Sometimes the hardest part of a data analysis project is getting the data required. It is even possible that the lack of data or form of data requires us to change our method for a solution.
Now for the fun part (cue sarcasm), cleaning the data. As a data analyst, data scientist, or whatever new buzz word is out there (data wrangler?), a majority of your job will be data janitoring, data cleaning, and data formatting. One harsh aspect of working in the industry is that data is never in the form you want. This is a skill set that I had to work to develop on my own, as academic data sets never required much cleaning. This is also one of the most frustrating parts of the process and it also can take a lot of time. Just sit your butt down and pick your favorite tool/software package and hack away at the data. As for what to look for, consider the process below.
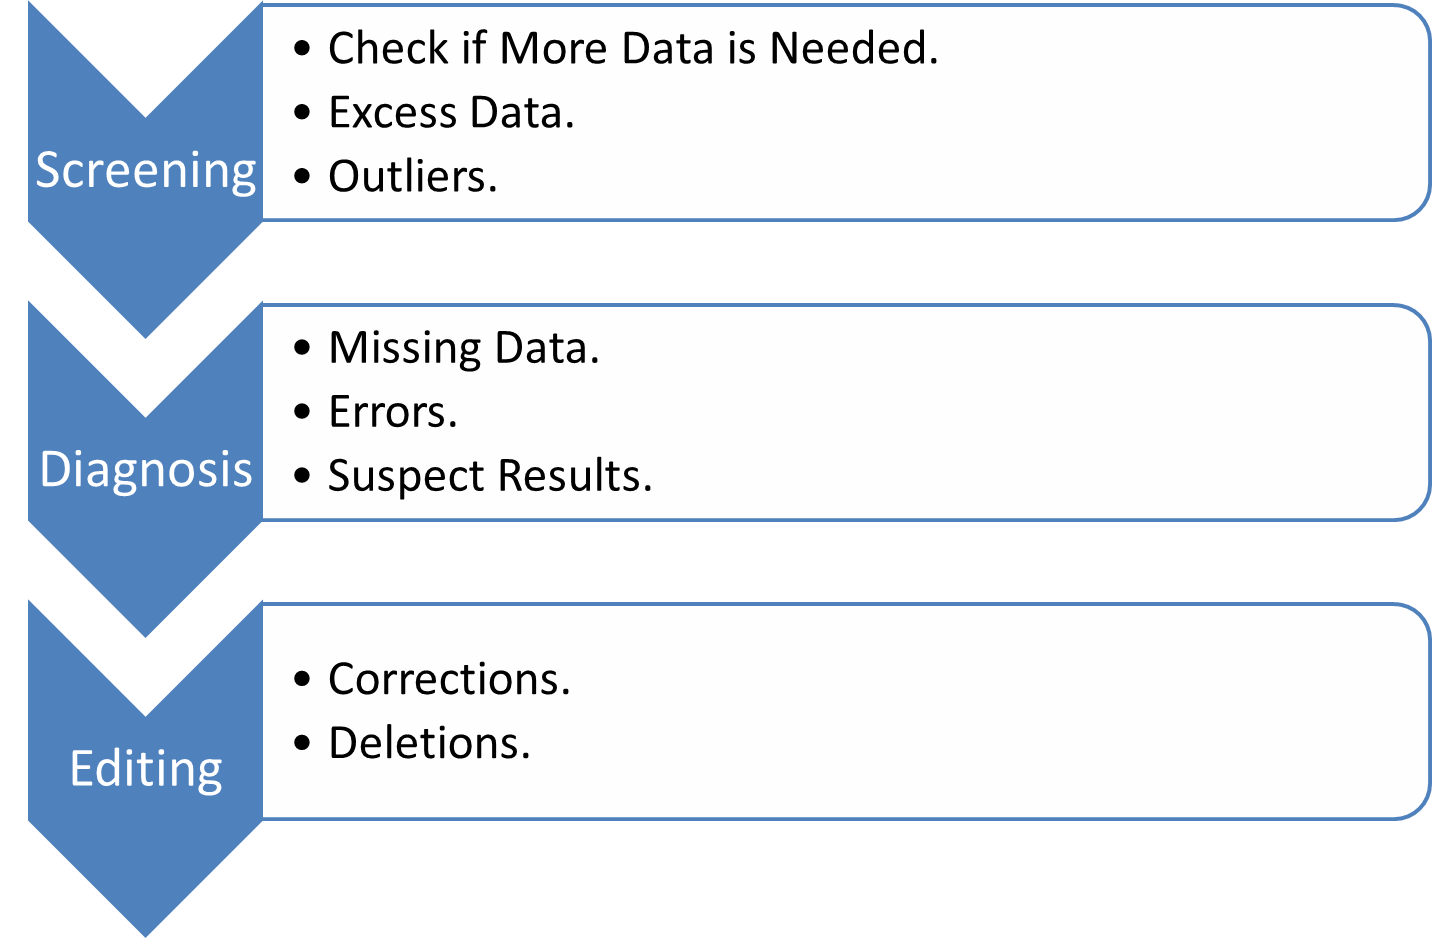
At this time, I recommend doing some sanity and quality checks of the data. Did you just import a data point for each hour of each day? Check for that. Check for outliers. Check for missing data, if there is missing data, is it missing at random?
At this point, the fun begins. We get to do what we wanted. Now we can make the data dance, sing, and do headstands at our command. From this point on, the method of data analysis is very unique to the problem. But to get started, I always do some sort of initial data exploratory analysis. This means I produce scatter plots, means, variances, correlations, pivot tables, etc… This helps me become intimately familiar with the data, which in turn helps me see the quality of the data.
Let’s recap.
i. Talk about the problem and ask questions.
ii. Brainstorm approaches.
iii. Find data sources, possibly modify approach based on data source.
iv. Data cleaning and formatting.
v. Check data for outliers/missing data.
vi. Exploratory data analysis (become intimate with the data).
vii. Commence methods to approach solution/test hypothesis.
In academia, most of the time we start at step (vi) or (vii) and skip some important stuff. In the industry, you get to work with people who are not mathematically inclined. This isn’t a problem unless they are stubborn and refuse to see logic. Dealing with these people is a whole different problem, and I wish you luck.
Cheers.