The Breeder's Equation has always fascinated me. I worked a bit with this equation in graduate school, and now that I'm free to work with whatever interests me at the moment, so I thought I would bring this back up. This equation is as follows:

This equation tells us the phenotypic response (R) in a population generation under some selective force (S) which depends also on the heritability (h) of the trait. A naive example is to consider a trait that is fully heritable (h=1), then the response in a generation is exactly equal to the selected trait. Unfortunately, most traits have heritability that fall somewhere between 0 and 1, this is the hard part to figure out. But all we have to do is wait a generation of intense selection and see the proportion of the population that follows the selection and we have our heritability. This is well-played out with controlled populations that breed discretely (e.g. agriculture products like corn, soybeans, cows...). Like it or not, we have been performing genetic modification of species ever since mankind changed from a hunter/gatherer society to an agriculture based society thousands of years ago. A farmer would always keep the best crops and use them for reseeding next year. Doing this, she imposes a selection force on the population towards a desired characteristic she wants. What about other populations that don't breed/reproduce so discretely? You might even suggest that wild, uncontrolled populations tend to breed discretely as there are many wild animal populations that have a yearly breeding season or two. But let's widen our scope. Most of the life on this planet is single celled organisms. Bacteria, archea, single celled eukaryotes, etc... these populations definitely do NOT breed discretely. If you consider a whole population of bacteria, at any moment in time, there are many cells in various stages of reproduction (assuming a growing population). This equation can NOT be applied to such a population.
In mathematics there are a few ways to convert discrete equations to continuous. But we have to unravel the breeder's equation first. Let's consider it as follows.
=h^{2}(\mu_{p}-\mu)")
Here, the response, R, equals a difference in population means,  is the mean phenotypic trait of the offspring generation,
  is the mean phenotypic trait of the parent generation (that we are selecting for), and
  the mean of the population as a whole. Again, a quick sanity check (h=1) will give us
  , a purely heritable trait. Now I want to write the equation to include time. We assume that
  is the 'generation time' of the population.
-\mu(t))=h^{2}(\mu_{p}-\mu(t))")
or
-\mu(t))}{g}=\frac{h^{2}}{g}(\mu_{p}-\mu(t))")
I think you can see how this is going to work. Now we want the limit as  and we'll arrive at a continuous derivative.
=\frac{h^{2}}{g}(\mu_{p}-\mu(t))")
This non-homogeneous first order differential equation is solvable with the condition that  . I'll save you the fun details that you can find in any differential equations book and skip to the answer.
![\mu(t)=\mu_{p}\left[ 1+ \left( \frac{\mu_{0}}{\mu_{p}} -1 \right) e^{-\frac{h^{2}}{g}t} \right]](https://s0.wp.com/latex.php?latex=%5Cmu%28t%29%3D%5Cmu_%7Bp%7D%5Cleft%5B+1%2B+%5Cleft%28+%5Cfrac%7B%5Cmu_%7B0%7D%7D%7B%5Cmu_%7Bp%7D%7D+-1+%5Cright%29+e%5E%7B-%5Cfrac%7Bh%5E%7B2%7D%7D%7Bg%7Dt%7D+%5Cright%5D&bg=ffffff&fg=000000&s=3 "\mu(t)=\mu_{p}\left[ 1+ \left( \frac{\mu_{0}}{\mu_{p}} -1 \right) e^{-\frac{h^{2}}{g}t} \right]")
This is a very interesting equation. Let's look at a graph of the situation where the heritability (h) = 0.5, the generation time (g) = 1 unit, the starting phenotypic trait ( ) is 1 and we are selecting for a phenotype of 2 ().
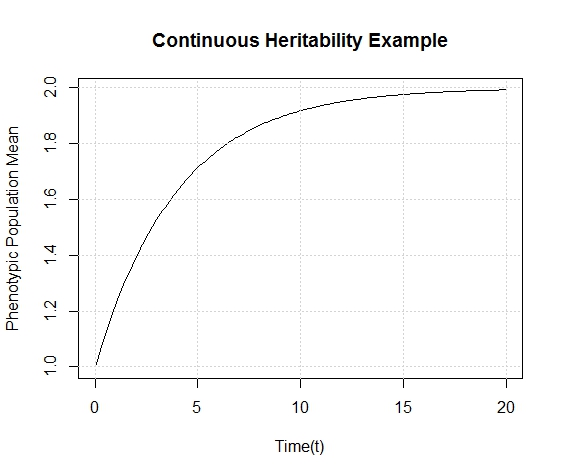
This graph looks exactly as we would expect the population to behave- over time the population approaches the phenotypic value we select. I hope to find some actual data out there soon that approximates this curve. But I'll save that for later, as I don't feel like combing through evolutionary microbiology articles right now.