More and more I'm using the 'apply' functions in R (apply, mapply, sapply, lappy,...). The help functions on these are hard to decipher. Not till I read a post by Neil Saunders, did I really start using them instead of loops.
Lately, I've been creating more nested-apply functions, i.e., an apply function within an apply function. The latest nested apply function I created does something really neat with specific data. What it does is create a list of indices in a sparse matrix down columns of blocks of numbers. Let's look at a simple example.
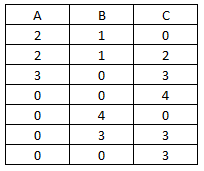
Let's say here is our raw data:
What we are looking to create in R is a list of the block indices of non-zero numbers by column. Here is the function with it's output:
> data = matrix(data=c(2,2,3,0,0,0,0,1,1,0,0,4,3,0,0,2,3,4,0,3,3),

+ nrow=7,ncol=3,dimnames=list(1:7,c("A","B","C")))

> data

  A B C

1 2 1 0

2 2 1 2

3 3 0 3

4 0 0 4

5 0 4 0

6 0 3 3

7 0 0 3
The output we seek is a list containing the indices for each non-zero block. For example we want the output for column A to look like:
A[[1]] = 1 2 3 (because the first three positions in column A are non-zero and compromise one block of numbers.
Column B has two blocks, so the output should be:
B[[1]] = 1 2
B[[2]] = 5 6
Here's the nested apply function to create this list (lapply nested inside an apply on the columns).
> list.data = apply(data,2,function(x) lapply(unique(cumsum(c(FALSE, diff(which(x>0))!=1))+1),function(y){

+     which(x>0)[(cumsum(c(FALSE, diff(which(x>0))!=1))+1)==y]

+ }))

> list.data

$A

$A[[1]]

1 2 3

1 2 3

$B

$B[[1]]

1 2

1 2

$B[[2]]

5 6

5 6

$C

$C[[1]]

2 3 4

2 3 4

$C[[2]]

6 7

6 7
Let's break it down step by step. The first thing is to find the non-zero indices. (Let's perform this on the second column, B)
> which(data[,2]>0)

1 2 5 6

1 2 5 6
Remember R reads down columns. Now let's find where non-consecutive differences occur (to separate the blocks).
> diff(which(data[,2]>0))

2 5 6

1 3 1
Notice, wherever there are non-ones is where the break occurs. But because of how the 'diff' function works, we need to add a position in front. Let's also convert them to logicals.
> c(FALSE, diff(which(data[,2]>0))!=1)

          2     5     6

FALSE FALSE  TRUE FALSE
If we do a cumulative sum of these logicals (remember FALSE = 0, and TRUE = 1) we will have separated the blocks with integers starting at 1.
> cumsum(c(FALSE, diff(which(data[,2]>0))!=1))

  2 5 6

0 0 1 1
If we add one and find the unique ones, we get:
> unique(cumsum(c(FALSE, diff(which(data[,2]>0))!=1))+1)

[1] 1 2
Now let's wrap it up in a 'lapply' function to return a list for column B:
> lapply(unique(cumsum(c(FALSE, diff(which(data[,2]>0))!=1))+1),function(y){

+     which(data[,2]>0)[(cumsum(c(FALSE, diff(which(data[,2]>0))!=1))+1)==y]

+ })

[[1]]

1 2

1 2
[[2]]
5 6
5 6
Now we just stick it in an apply function across the columns to find the indices of blocks of non-zero numbers. (Or across rows if you want.)
> apply(data,2,function(x) lapply(unique(cumsum(c(FALSE, diff(which(x>0))!=1))+1),function(y){

+     which(x>0)[(cumsum(c(FALSE, diff(which(x>0))!=1))+1)==y]

+ }))

$A

$A[[1]]

1 2 3

1 2 3

$B

$B[[1]]

1 2

1 2

$B[[2]]

5 6

5 6

$C

$C[[1]]

2 3 4

2 3 4

$C[[2]]

6 7

6 7
Sometimes I get so proud of my nested apply functions... sniff... sniff. One day I hope to write a triple nested apply function. I hope someone finds this useful.

